LogoLogo
OS Docs HomeOS NGDOS APIsOS Download ProductsMore than MapsContact Us
  • More than Maps
  • Geographic Data Visualisation
    • Guide to cartography
      • Introduction to cartography
      • Types of maps
      • Symbology
      • Colour
      • Text on maps
      • Generalisation
      • Coordinate reference systems
      • Projections
      • Scale
      • Map legends
      • Map layout
      • Relief representation
      • North arrows
    • Guide to data visualisation
      • Introduction to data visualisation
      • GeoDataViz design principles
      • Types of visualisation
      • Thematic mapping techniques
      • Data visualisation critique
      • Accessible data visualisation
      • Ethical data visualisation
      • Software
      • Data
    • GeoDataViz assets
      • GeoDataViz basemaps
      • Stylesheets
      • GeoDataViz virtual gallery
      • Equal area cartograms
      • How did I make that?
        • Apollo 11 Landing
        • North York Moors National Park, 70 years
        • Snowdonia National Park, 70 years
        • Great Britain's National Parks
        • Great Britain's Islands
        • Great Britain's AONB's and National Scenic Areas
        • Famous shipwrecks of Pembrokeshire
        • Trig pillars today
        • Britain's most complex motorway junctions
      • #30DayMapChallenge
  • Data in Action
    • Examples
  • Demonstrators
    • 🆕Product Viewer
    • Addressing & location demonstrators
      • Address Portfolio overview
      • Which address product should you use?
      • AddressBase
      • AddressBase Core
      • AddressBase Plus
      • AddressBase Premium
      • Address Classifications
      • Addressing Lifecycle
      • OS Emergency Services Gazetteer
      • What are Vertical Streets?
      • Why are there differences in boundaries?
    • Contextual demonstrators
    • Customer best practice
      • Channel Shift
      • Data Management and OS Data Hub
      • End User Licence vs Contractor Licence
      • 🆕 IDs vs Spatial Relationships
      • Why we should capture good quality addresses at source
      • Why we Snap and Trace
    • Network Demonstrators
      • OS Detailed Path Network
      • OS Multi Modal Routing Network
        • OS Multi Modal Routing Network
      • Water Networks overview
      • OS MasterMap Highways Network and OS NGD Speeds
      • OS MasterMap® Highways Network and OS Open Roads™
    • OS MasterMap Generation APIs
      • Using the OS Features API
      • Using the OS Features API Archive
      • Using the OS Downloads API
      • Using OS APIs in ESRI Software
    • 🆕OS NGD (National Geographic Database)
      • OS NGD Address
      • OS NGD Boundaries
      • 🆕OS NGD Buildings
        • 🆕Building and Building Access Feature Types
        • Building Part and Building Line Feature Types
      • 🆕OS NGD Geographical Names
      • OS NGD Land
      • OS NGD Land Cover enhancements
      • 🆕OS NGD Land Use
      • OS NGD Land Use enhancements
      • 🆕OS NGD Structures
        • 🆕OS NGD Structures
        • Field Boundaries
      • 🆕OS NGD Transport Features
      • 🆕OS NGD Transport Network
      • OS NGD Transport RAMI
      • OS NGD Water Features
      • OS NGD Water Network
      • OS NGD API - Features
      • Ordering OS NGD data
      • Change only updates
      • OS NGD Versioning
      • Creating a topographic map from OS NGD Data
      • Analytical styling for OS NGD data
    • OS MasterMap® demonstrators
    • 🆕Product & API Comparisons
      • 🆕Comparison of Water Network Products
  • Tutorials
    • GeoDataViz
      • Thematic Mapping Techniques
      • Downloading and using data from the OS Data Hub
      • How to download and use OS stylesheets
      • How to use the OS Maps API
      • Creating a bespoke style in Maputnik
    • GIS
      • Analysing pavement widths
      • Basic routing with OS Open Data and QGIS
      • Walktime analysis using OS Multi-modal Routing Network and QGIS
      • Creating 3D Symbols for GIS Applications
      • Constructing a Single Line Address using a Geographic Address
      • Creating a Digital Terrain Model (DTM)
      • Visualising a road gradient using a Digital Terrain Model
      • Visualising a road gradient using OSMM Highways
    • 🆕APIs
      • 🆕Using OS APIs with EPC API
      • 🆕OS APIs and ArcGIS
  • Deep Dive
    • Introduction to address matching
    • Guide to routing for the Public Sector
      • Part 1: Guide to routing
      • Part 2: Routing software and data options
      • Part 3: Building a routable network
    • Unlocking the Power of Geospatial Data
    • Using Blender for Geospatial Projects
    • A Guide to Coordinate Systems in Great Britain
      • Myths about coordinate systems
      • The shape of the Earth
      • What is position?
        • Types of coordinates
        • We need a datum
        • Position summary
      • Modern GNSS coordinate systems
        • Realising WGS84 with a TRF
        • The WGS84 broadcast TRF
        • The International Terrestrial Reference Frame (ITRF)
        • The International GNSS Service (IGS)
        • European Terrestrial Reference System 1989 (ETRS89)
      • Ordnance Survey coordinate systems
        • ETRS89 realised through OS Net
        • National Grid and the OSGB36 TRF
        • Ordnance Datum Newlyn
        • The future of British mapping coordinate systems
        • The future of British mapping coordinate systems
      • From one coordinate system to another: geodetic transformations
        • What is a geodetic transformation?
        • Helmert datum transformations
        • National Grid Transformation OSTN15 (ETRS89–OSGB36)
        • National Geoid Model OSGM15 (ETRS89-Orthometric height)
        • ETRS89 to and from ITRS
        • Approximate WGS84 to OSGB36/ODN transformation
        • Transformation between OS Net v2001 and v2009 realisations
      • Transverse Mercator map projections
        • The National Grid reference convention
      • Datum, ellipsoid and projection information
      • Converting between 3D Cartesian and ellipsoidal latitude, longitude and height coordinates
      • Converting between grid eastings and northings and ellipsoidal latitude and longitude
      • Helmert transformation worked example
      • Further information
  • Code
    • Ordnance Survey APIs
    • Mapping
    • Routing with pgRouting
      • Getting started with OS MasterMap Highways and pgRouting
      • Getting started with OS MasterMap Highways Network - Paths and pgRouting
      • Getting started with OS NGD Transport Theme and pgRouting
      • Getting started with OS NGD Transport Path features and pgRouting
  • RESOURCES
    • 🆕Data Visualisation External Resources
Powered by GitBook

Website

  • Ordnance Survey

Data

  • OS Data Hub
On this page
  • Creating a poster of Britain’s National Parks
  • Facts and figures
  • More information on Britain’s National Parks poster

Was this helpful?

  1. Geographic Data Visualisation
  2. GeoDataViz assets
  3. How did I make that?

Great Britain's National Parks

PreviousSnowdonia National Park, 70 yearsNextGreat Britain's Islands

Last updated 1 year ago

Was this helpful?

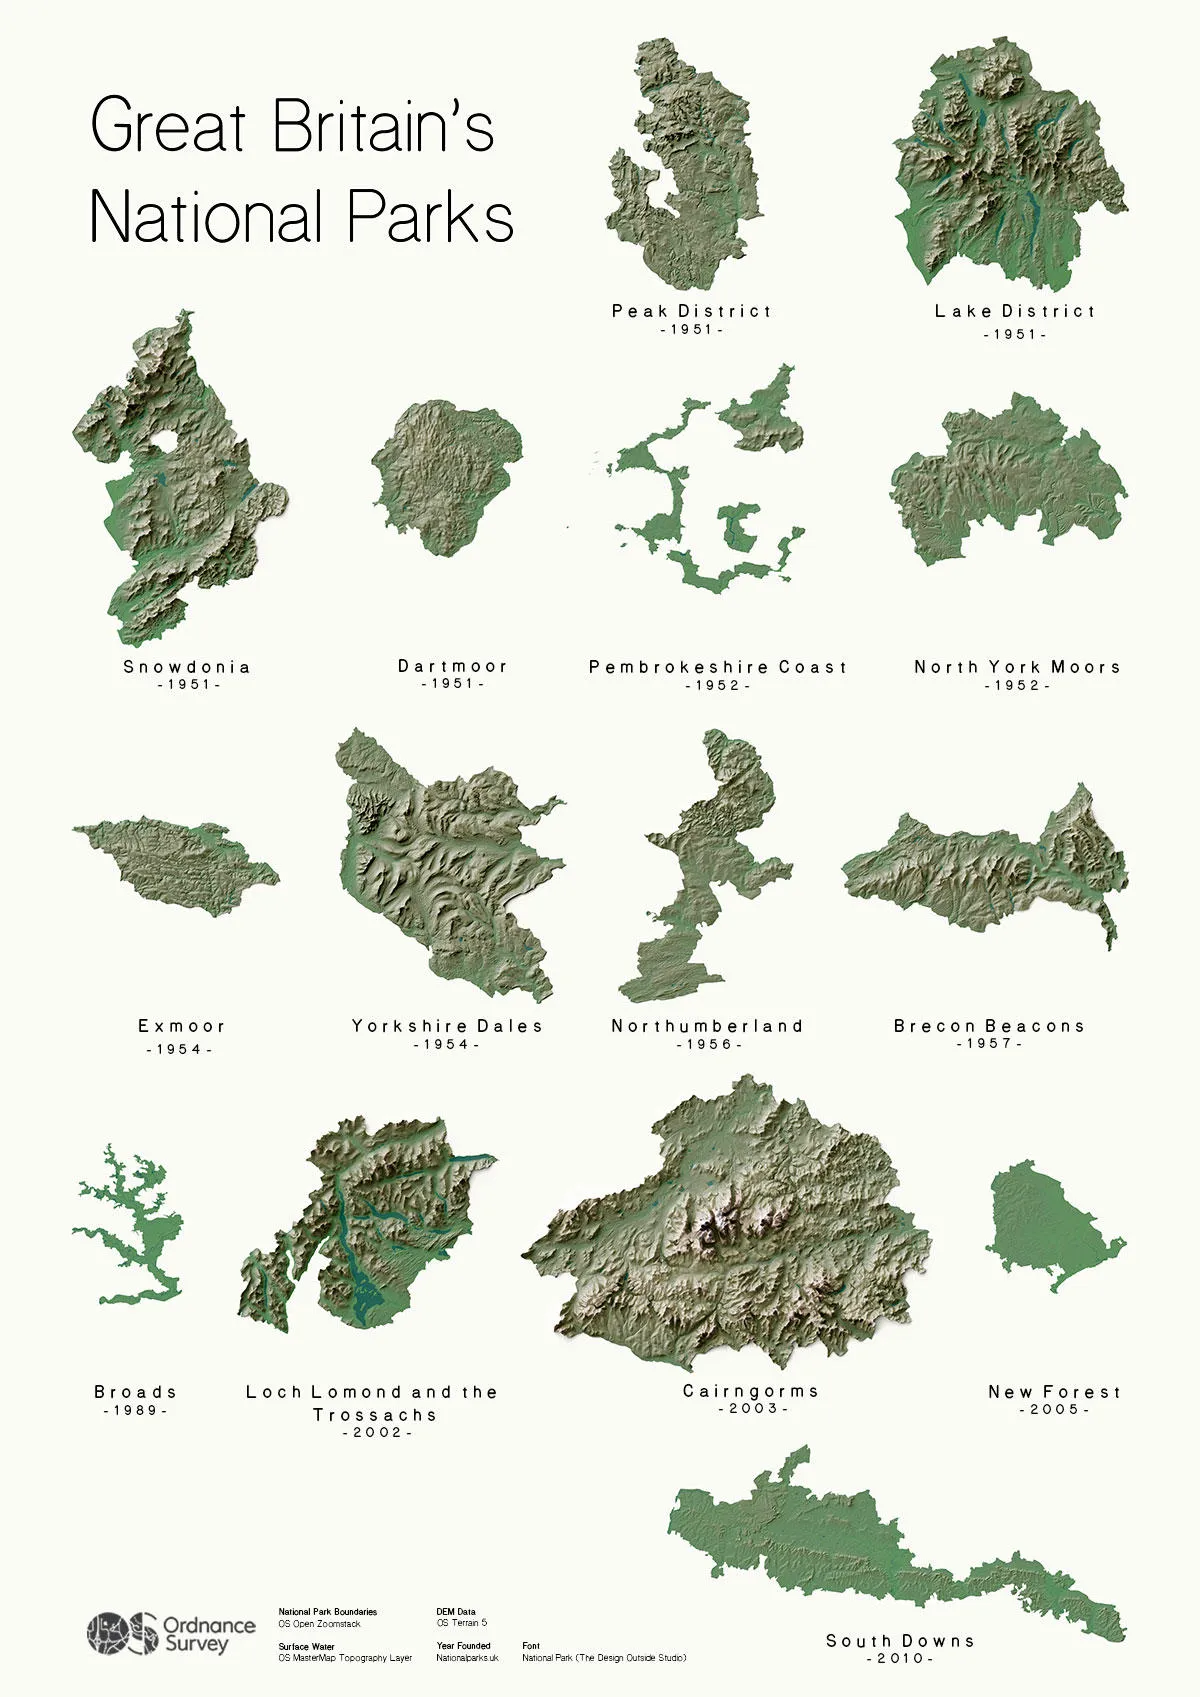
It’s 70 years since the 1949 Act of Parliament that began the family of National Parks in Great Britain, and our GeoDataViz team have created a stunning poster to showcase the varied landscapes of our 15 beautiful National Parks.

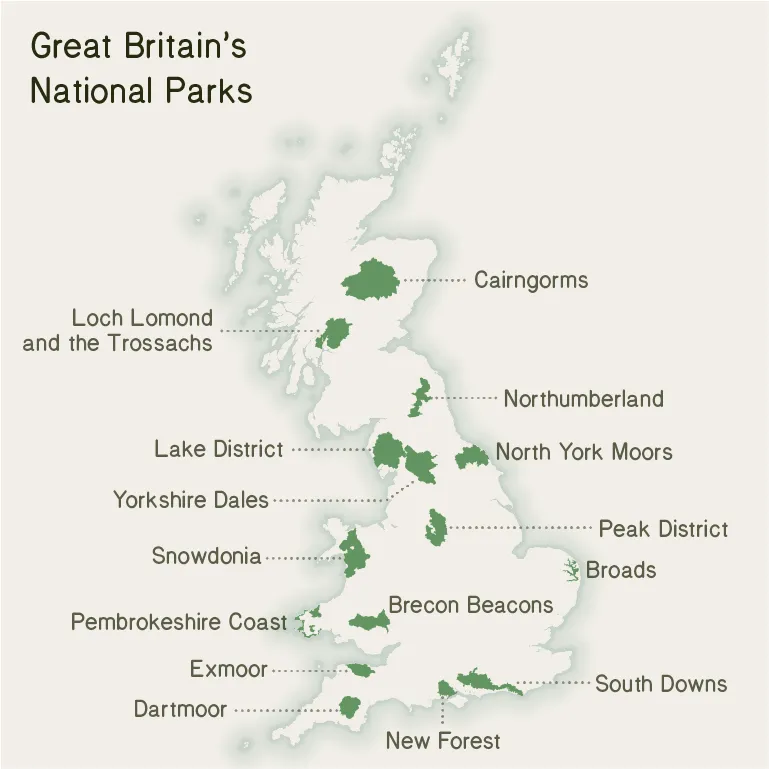
Covering a combined area of 23,138 km2 (that’s around 10% of Great Britain and an area slightly larger than Wales) the National Parks offer us a stunning variety of landscapes to explore. With two parks in Scotland, three in Wales and ten in England, they’re accessible to many of us, no matter where we live.

Great Britain's National Parks

Creating a poster of Britain’s National Parks

  • Clip the OS Terrain 5 raster to OS Open Zoomstack national park polygons using PostGIS. This helps us show the heights of the parks.

  • Process the OS Terrain 5 raster using ArcMap.

  • Generate hillshades from the processed Terrain 5 raster using Blender, to create the 3D surface of the parks.

  • Create terrain style with OS Terrain 5 and surface water from OS MasterMap Topography Layer using QGIS.

  • Compile the terrain styles and hillshades with Adobe Photoshop.

Once each National Park was finished, it was a matter of lining each one up for the poster. The parks are ordered by the year they were created, from the Peak District in 1951 down to the South Downs in 2010.

Facts and figures

From mountains to moorland to coast, there is something for everyone in our National Parks. Unsurprisingly, the Pembrokeshire Coast boasts the longest coastline at 418 km, while just six of the parks have no coastline at all (Brecon Beacons, Cairngorms, Dartmoor, Northumberland, Peak District and Yorkshire Dales).

Largest parks:

  1. Cairngorms (4528 km2)

  2. Lake District (2362 km2)

  3. Yorkshire Dales (2179 km2)

Most densely populated parks:

  1. South Downs

  2. New Forest

  3. Pembrokeshire Coast

Highest points:

  1. Cairngorms, Ben Macdui, 1309 m

  2. Loch Lomond and the Trossachs, Ben More, 1174 m

  3. Snowdonia, Snowdon, 1085 m

Most paths for walkers:

  1. Lake District, 7189 km

  2. Cairngorms, 7028 km

  3. South Downs, 6468 km

More information on Britain’s National Parks poster

Joe Harrison in our GeoDataViz team created the beautiful artwork, building on his experience of creating the poster last year. The poster was produced using a variety of software, including PostGIS, ArcMap, Blender, QGIS and Adobe Photoshop. We used a range of our data to showcase the National Parks, including OS Terrain 5, OS Open Zoomstack and OS MasterMap Topography Layer.

Joe’s process for creating the National Park images was inspired by Daniel Huffman at . It contains a step-by-step guide on how to create shaded relief in Blender. The steps were:

See the individual National Parks .

Get ideas to explore our National Parks .

Great Britain’s islands
SomethingAboutMaps
in our Flickr album
on our GetOutside blog
Map of Great Britain with National Parks highlighted and labelled