# Styling vector data
For each layer present in the data the colours have been assigned randomly. To make the map legible the Styled Layer Descriptors can be applied to each layer.
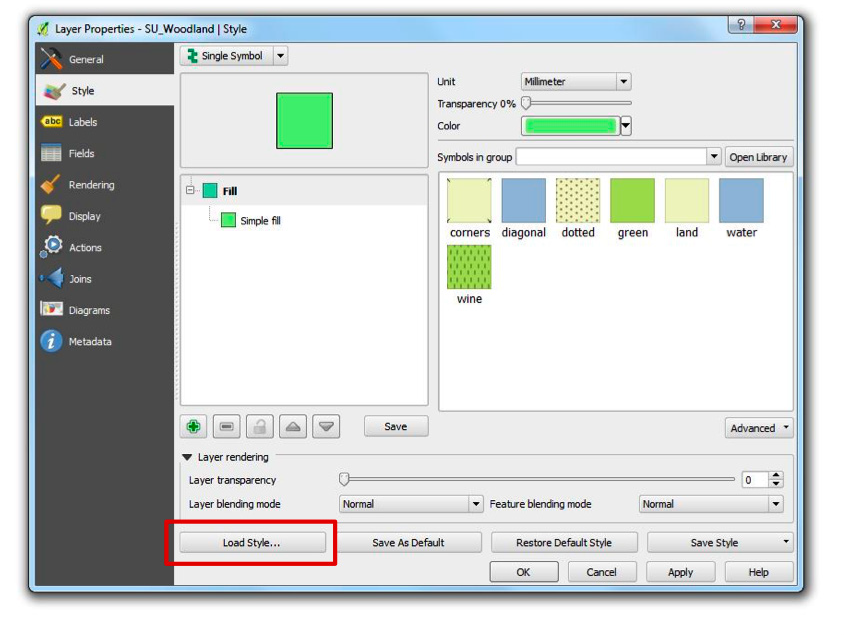
To do this first right click on the **‘SU\_Woodland’** layer and select **‘Properties’**.
* This will open a new window. Make sure the **‘Style’** tab on the left is selected.
Layer properties window
* Click ‘Load Style’ and a new window will open, navigate to the downloaded stylesheet folders
**OS-VectorMap-District-stylesheets-master > ESRI Shapefile stylesheets > QGIS stylesheets (QML) > Full Colour style** and select the **Woodland QML** file and click **‘Open’**.
* Repeat this for each layer selecting the respective QML file for each layer.
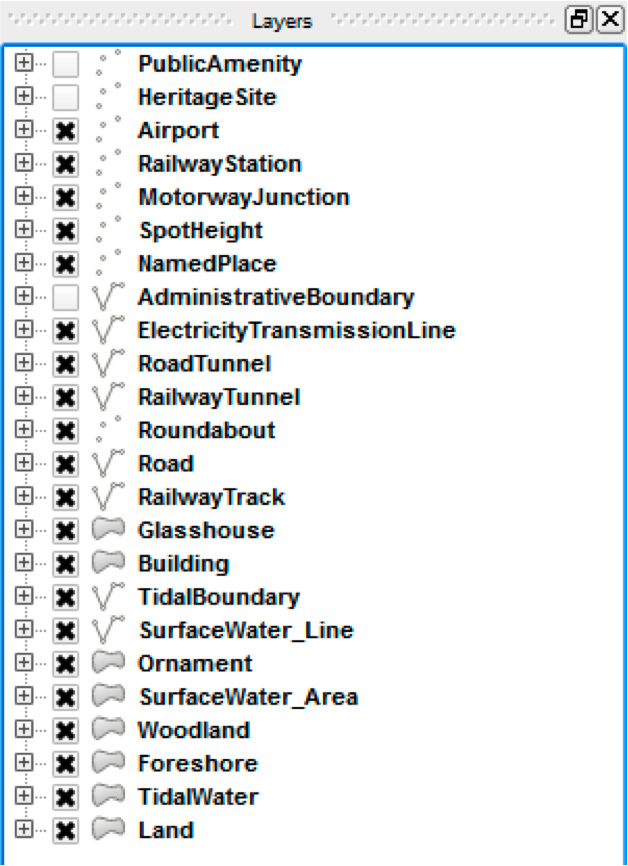
* For maximum legibility rearrange the order of the layers to match the image below:
layers window
* By clicking on the box next to the layer name the layer can be included or removed from the map.
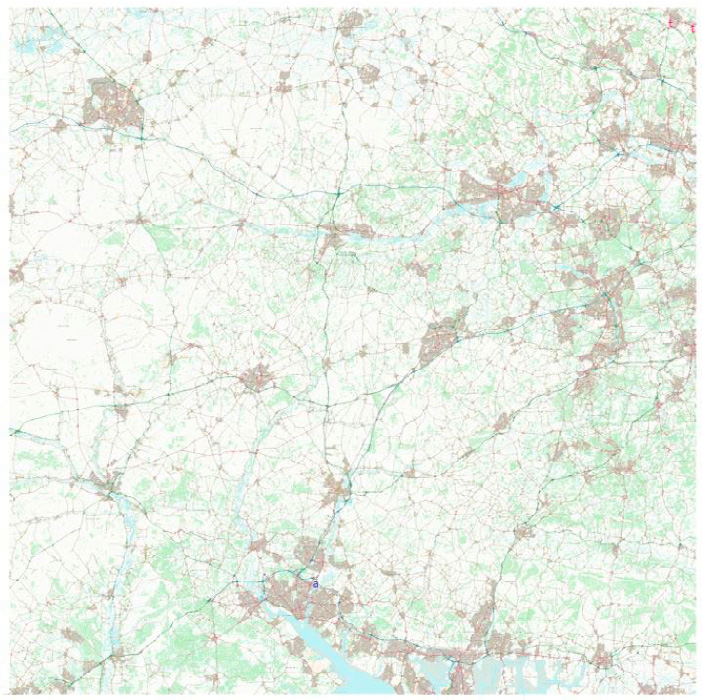
* The resultant map should look similar to this:
Map created from selecting the layers from the layers window above
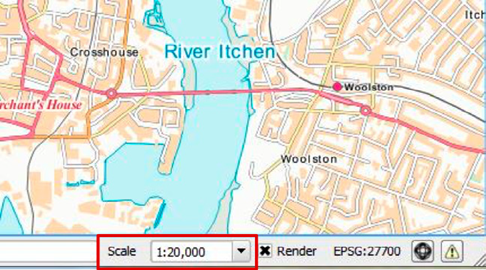
* The map is most functional for scales 1:15 000-1:30 000. For this tutorial we want a map of an area of Southampton at a scale of **1:20 000**. Use the **‘Pan tool’**, **‘Zoom in’** and **‘Zoom out’** to position the map over Southampton at an appropriate scale, or alternatively set the scale of the map by typing in the scale bar, which is at the bottom of the screen.